


CHART: DJX: DOW JONES 30 INDUSTRIALS AVERAGE INDEX
PERSPECTIVES:
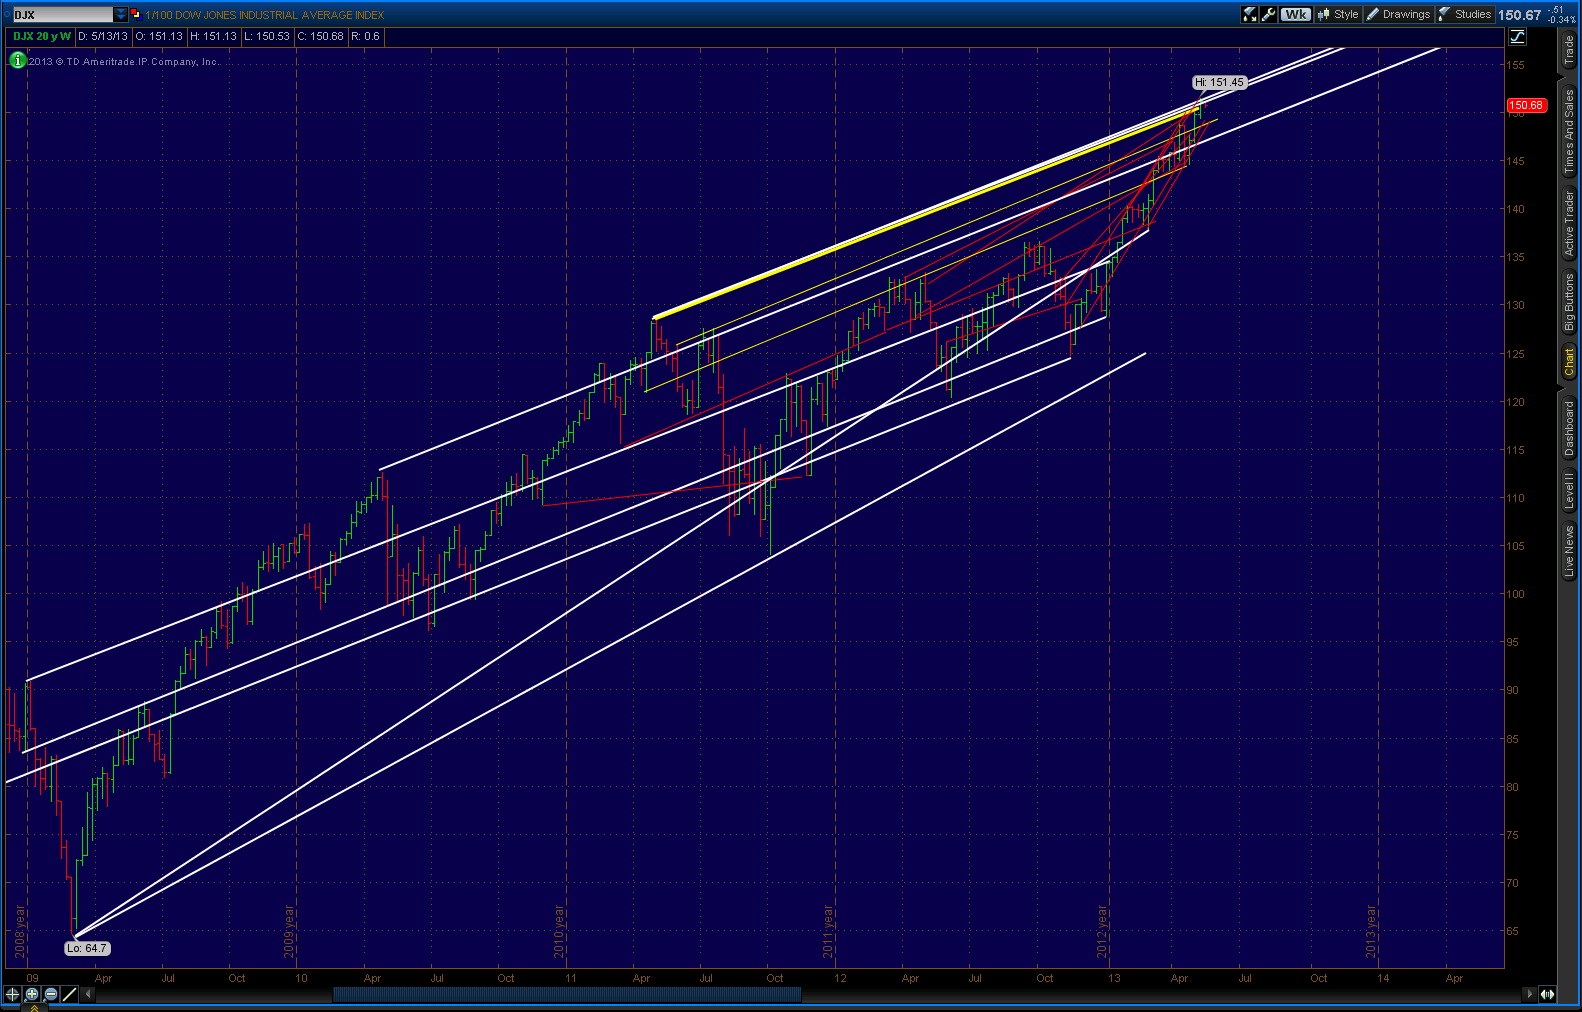
4-YEAR WEEKLY OHLC DJX MON 13 MAY 2013 1:50PM EASTERN DST
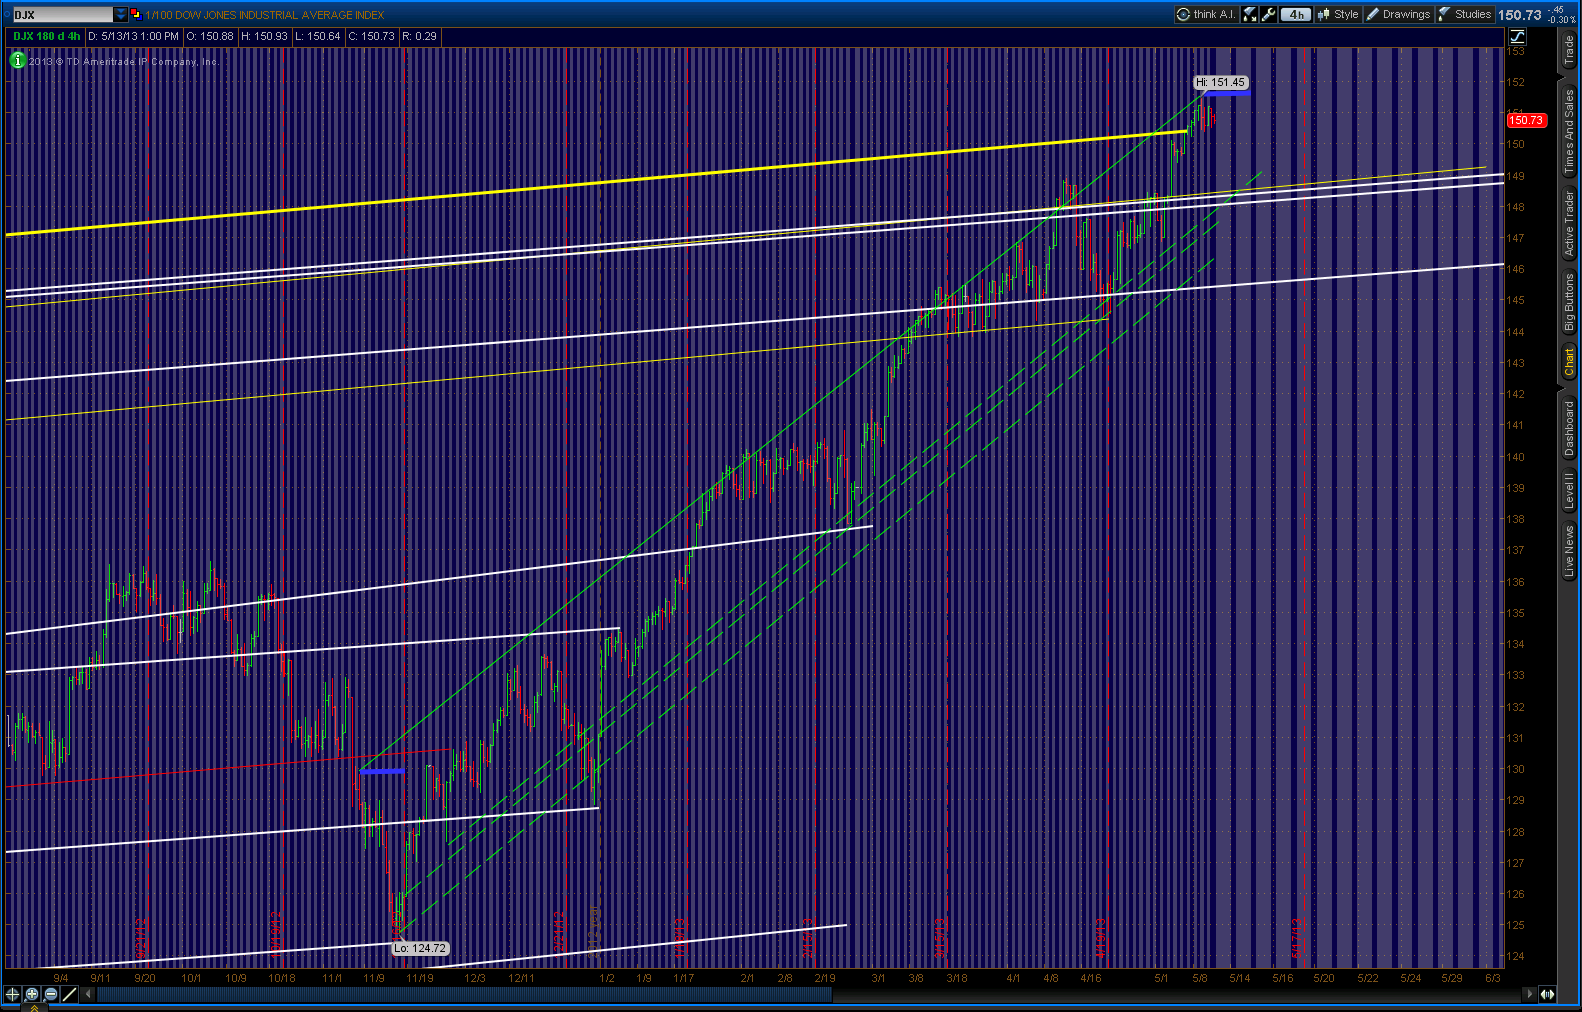
8-MONTH DAILY OHLC DJX MON 13 MAY 2013 2:15PM EASTERN DST
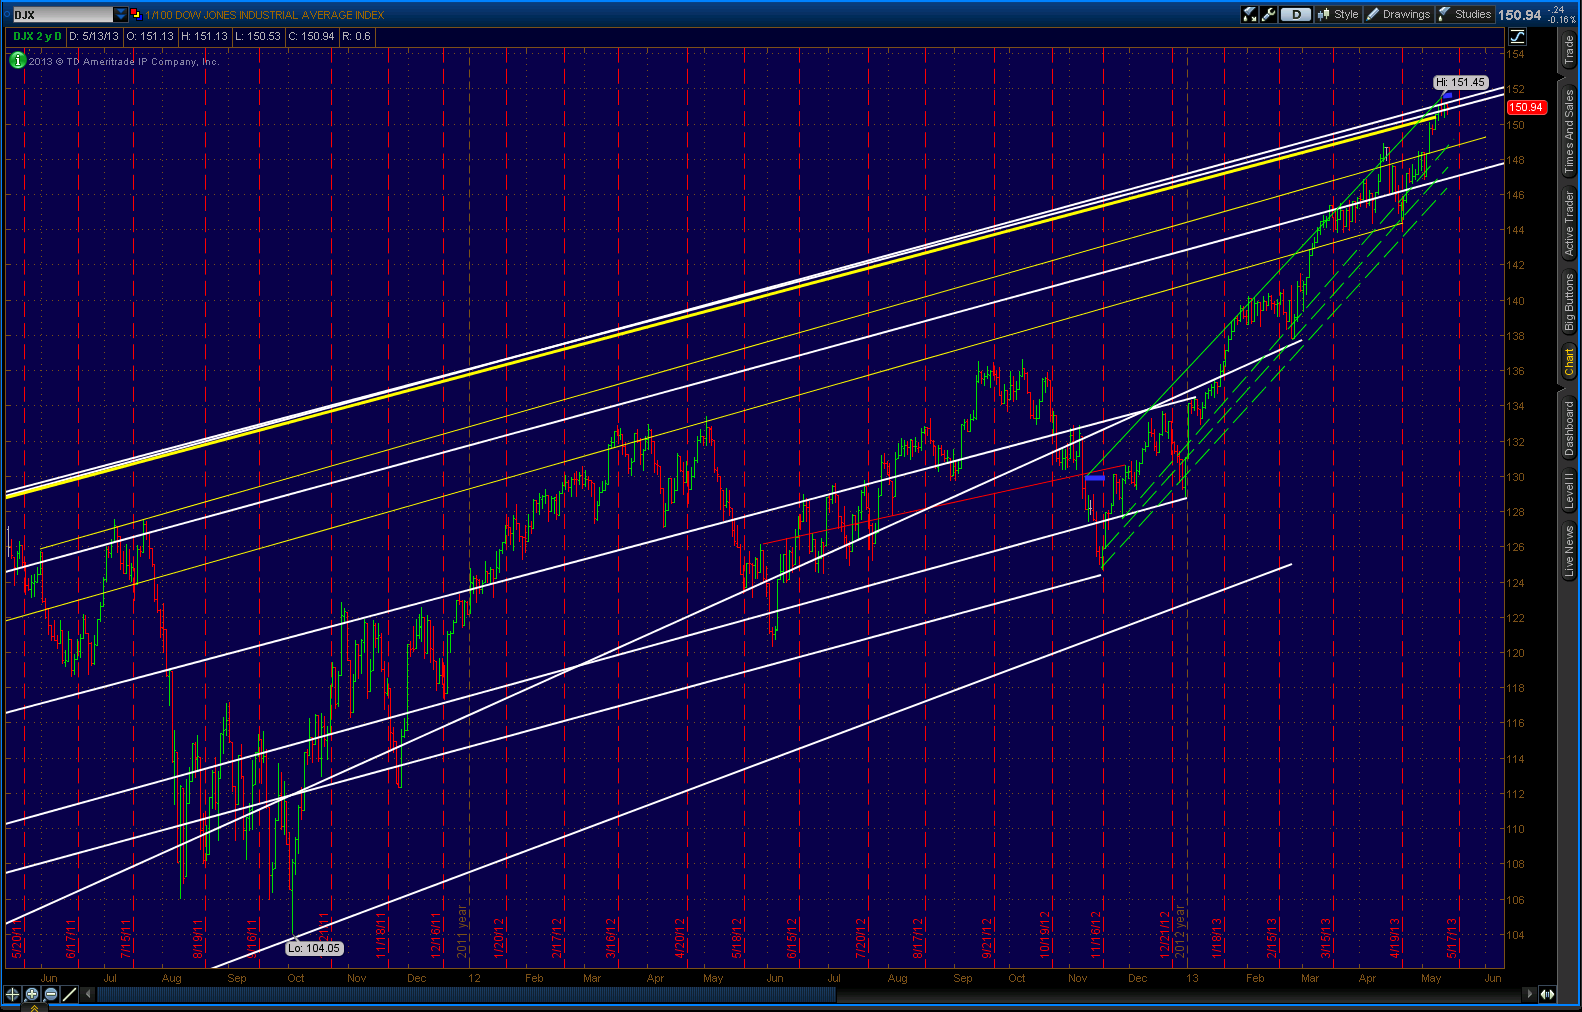
2-YEAR DAILY OHLC DJX MONDAY 13 MAY 2013 3:00PM EASTERN DST
Click on charts to enlarge and click on charts again to open new tab then click on charts in new tab to further zoom.
PRECISION PIVOTS ECHOVECTOR MDPP MODEL OUTPUT CHART ILLUSTRATION AND HIGHLIGHTS COLOR CODE GUIDE
1. Regime Change Cycle EchoVector (8 Year, Week-to-Week): Long AquaBlue
2. Regime Change Cycle EchoVector (8 Year, Week-to-Week): Long Yellow
3. Regime Change Cycle EchoVector (8 Year, Week-to-Week): Long Pink
4. Presidential Cycle EchoVector (4 Year, Day-to-Day): Long White
5. Congressional Cycle EchoVector (2 Year, Day-to-Day): Green
6. Congressional Cycle EchoVector (2 Year, Day-to-Day): Blue Purple
7. Congressional Cycle EchoVector (2 Year, Day-to-Day): Long Pink
8. Congressional Cycle EchoVector (2 Year, Day-to-Day): Long Yellow
9. Annual Cycle EchoVector (1 Year, Day-to-Day): Red
10. Annual Cycle EchoVector (1 Year, Day-to-Day): Pink
11. Annual Cycle EchoVector (1 Year, Day-to-Day): Long Blue Purple (Pivot Indicative)
12. 9-Month Cycle EchoVector (9 Months, Day-to-Day): Grey
13. Bi-Quarterly Cycle EchoVector (6 Months, Day-to-Day): Yellow
14. Quarterly Cycle EchoVector (3 Months, Day-to-Day): White
15. Monthly Cycle EchoVector (1 Month, Day-to-Day): Peach
16. Bi-Weekly Cycle EchoVector (1 Week, Day-to-Day): Short Grey
17. Weekly Cycle EchoVector (1 Week, Day-to-Day): Aqua Blue
18. Daily Cycle EchoVector (1 Day, Day-to-Day): Short Pink
19. Select Support or Resistance Vectors and/or Relative Price Extension Vectors (Various Lengths): Navy Blue
20. 5-Year Federal Reserve Bank Cycle: Black
Space-Color Vector Highlights are Graphical Illustrations of Corresponding and Coordinate Color-Length-Slope MDPP Forecast Model Key Active Focus EchoVectors.
ECHOVECTORVEST MDPP PRECISION PIVOTS MODEL LOGICS:
Trend period echovector echo-period price point level.
Trend period echovector echo-period price point level pivot extension: equal.
Trend period echovector echo-period price point level pivot extension: stronger: then potential echovector slope pivoting effect.
Trend period echovector echo-period price point level pivot extension: weaker: then potential echovector slope pivoting effect.
Trend period echovector echo-period price point level REVERSAL: Counter-Echo Pattern: Trend period echovector slope pivoting.
EP: EchoPivot: Trend Timing and Price Vector and Period Corresponding Pivot.
EPCP: EchoPivot CounterPivotPivot: Trend Timing and Price Vector and Period CounterTrend Corresponding CounterPivot (Induces greater force-slope up, or weaker force-slope up, or greater force-slope down, or weaker force-slope down).
DJX 4-YEAR WEEKLY OHLC MONDAY 13 MAY 2013 1:50PM EASTERN DST
DJX 8-MONTH DAILY OHLC MONDAY 13 MAY 2013 2:15PM EASTERN DST
DJX 2-YEAR DAILY OHLC MONDAY 13 MAY 2013 3:00PM EASTERN DST
BONUS PERSPECTIVE:
http://echovectorvest.blogspot.com/2013/05/spx-chart-thursday-2-may-2013-20-year.html
SPX CHART 20-YEAR WEEKLY OHLC
(Click to enlarge and right click to open in new tab and click again to further zoom)

"Some analysts believe we may be looking a bit overbought at current level, and they may be right; however, also look at a chart of this year's 'mid-Regime change cycle year' in the US ABOVE...
http://bit.ly/1032y14
This particular year in the cycle often does surprise to upside (as we leave the deflationary cycle), and does so especially from its Fall SEASON low, and often well into the following year... focus on the price vector from 4/14/97 to 4/18/2005 to 4/19/2013 (blue dotted)."
___________________________________________________________
No comments:
Post a Comment